
Included in suite
Smart Trend Trading System
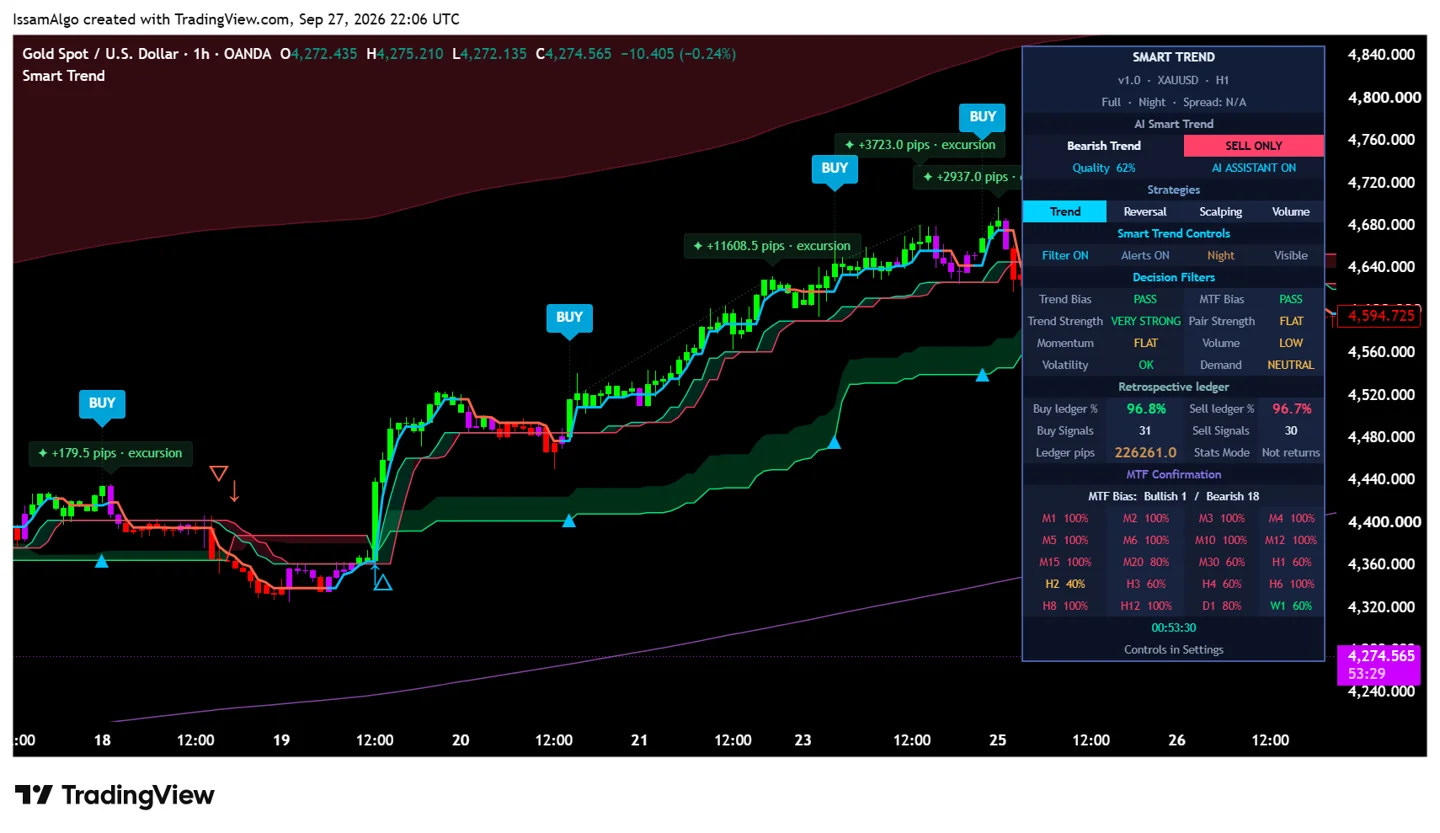
Bring trend direction, cloud layers, signals and chart levels into one view. Choose the analysis profile and amount of detail that suit your workflow.
Explore detailsExplore the real charts. Find your workflow. Seven suite indicators and four free tools.
Bring trend direction, cloud layers, signals and chart levels into one view. Choose the analysis profile and amount of detail that suit your workflow.
Explore details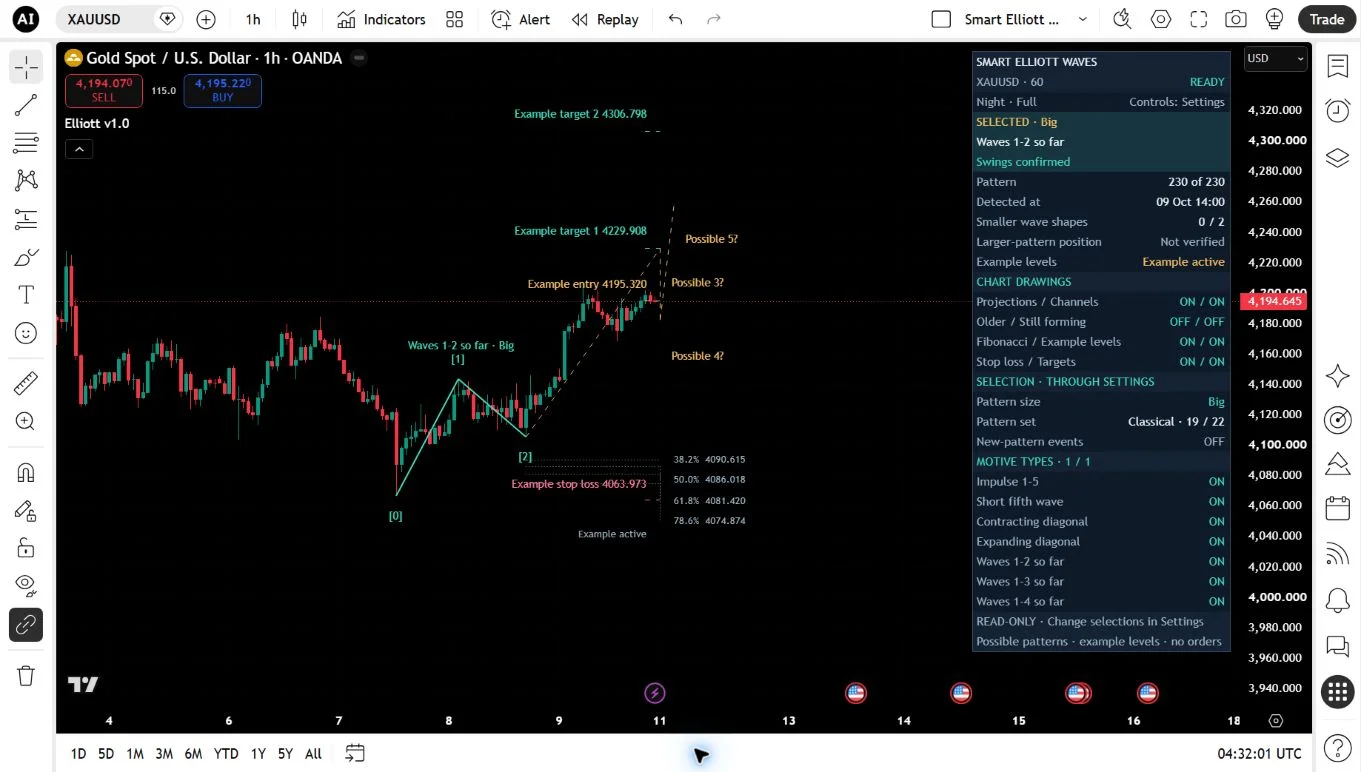
Explore possible wave structures at three swing scales, with a read-only status panel and optional price references.
Explore details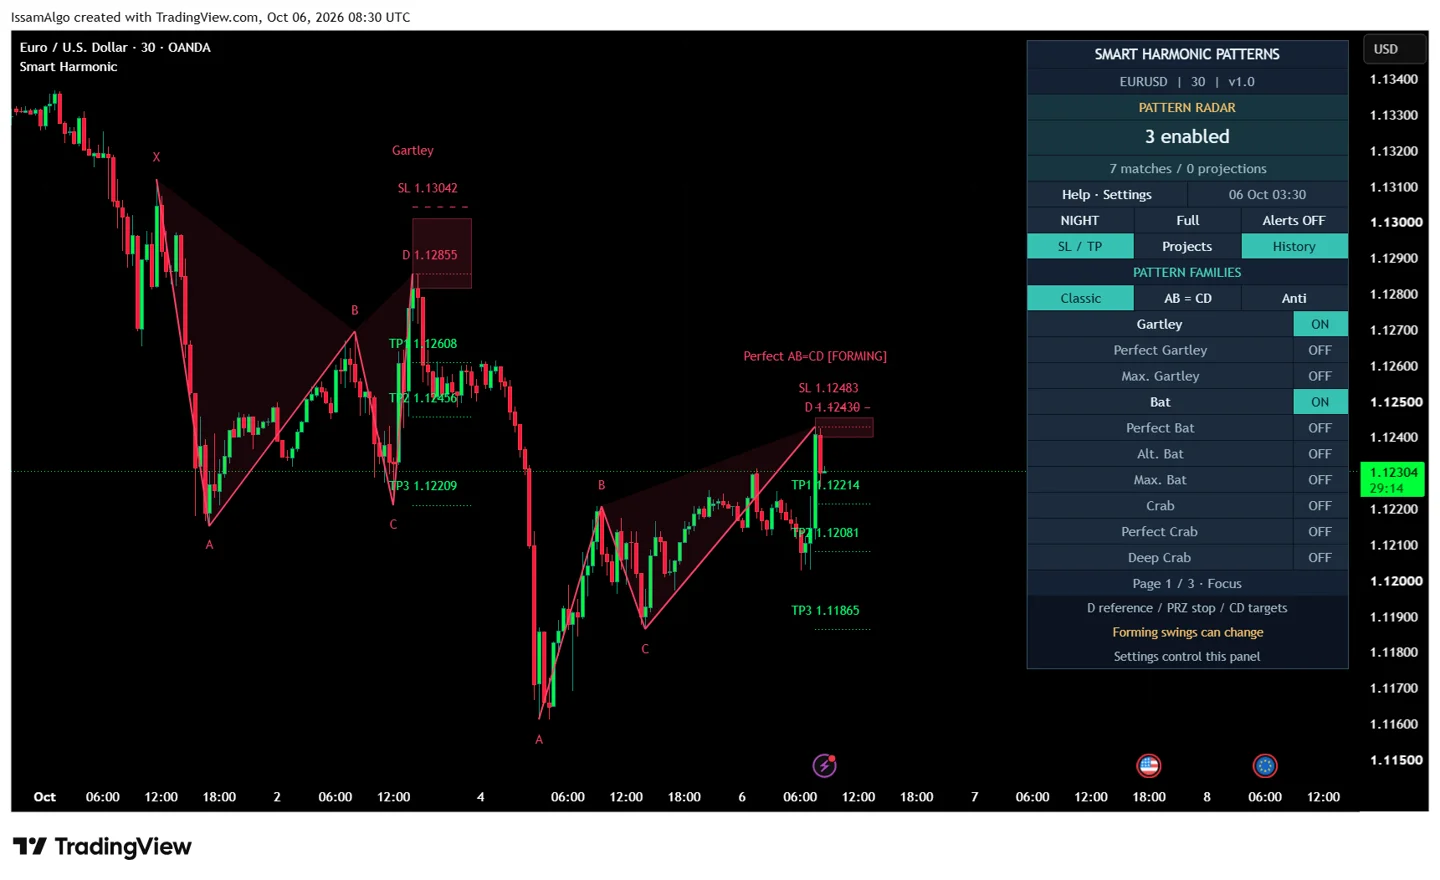
Explore 88 harmonic variants through a family-selection dashboard. Focus on Gartley, Bat and Perfect AB=CD, or choose individual variants.
Explore details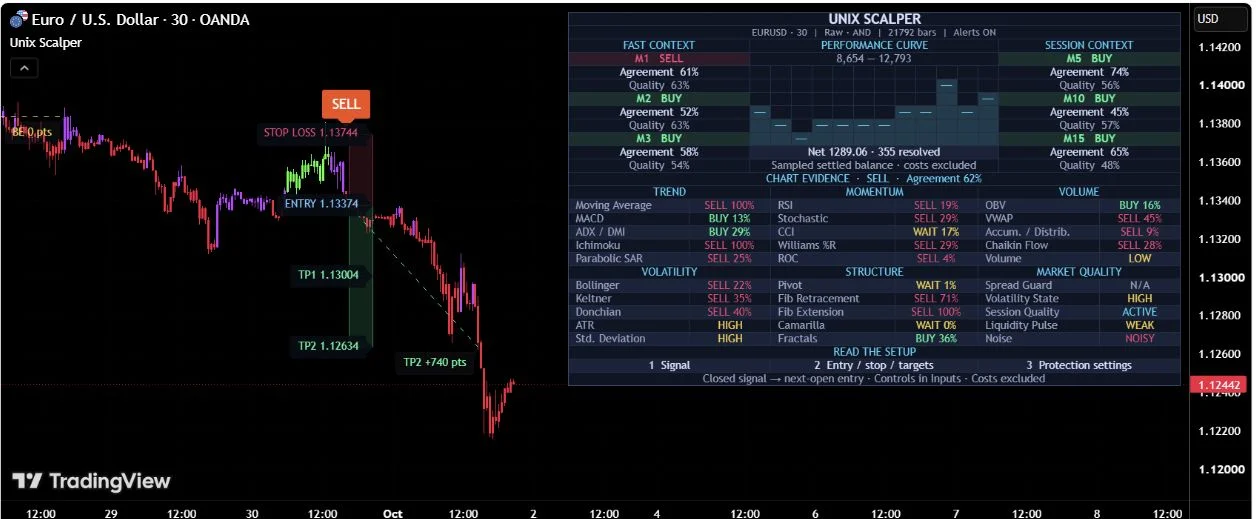
Follow filtered directional signals with compact trade plans and six timeframe cards. Review simulated outcomes in an organized dashboard.
Explore details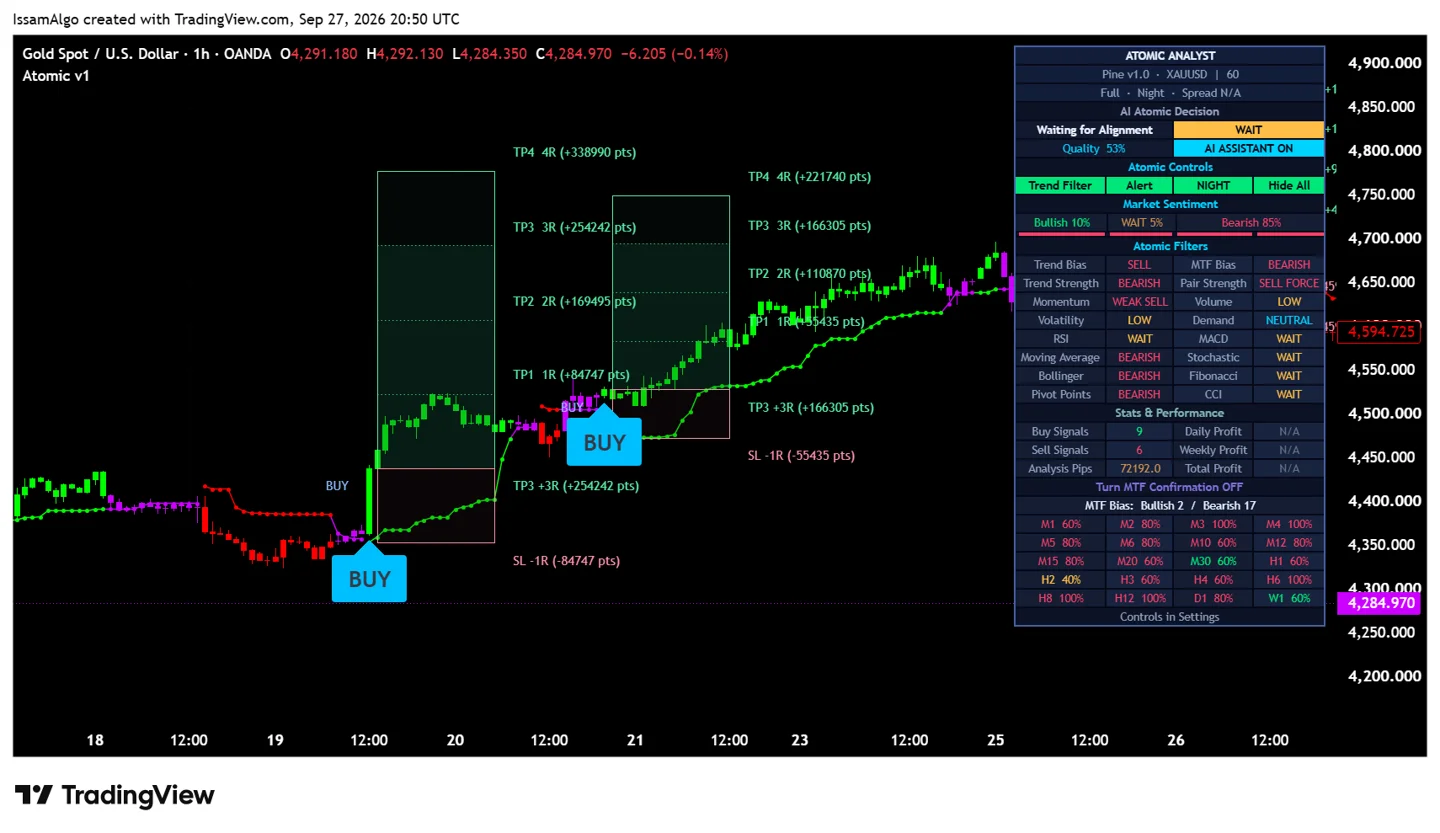
Read price action, momentum and multi-timeframe context alongside visual trade plans. See the relationship between entry, stop, target and break-even levels.
Explore details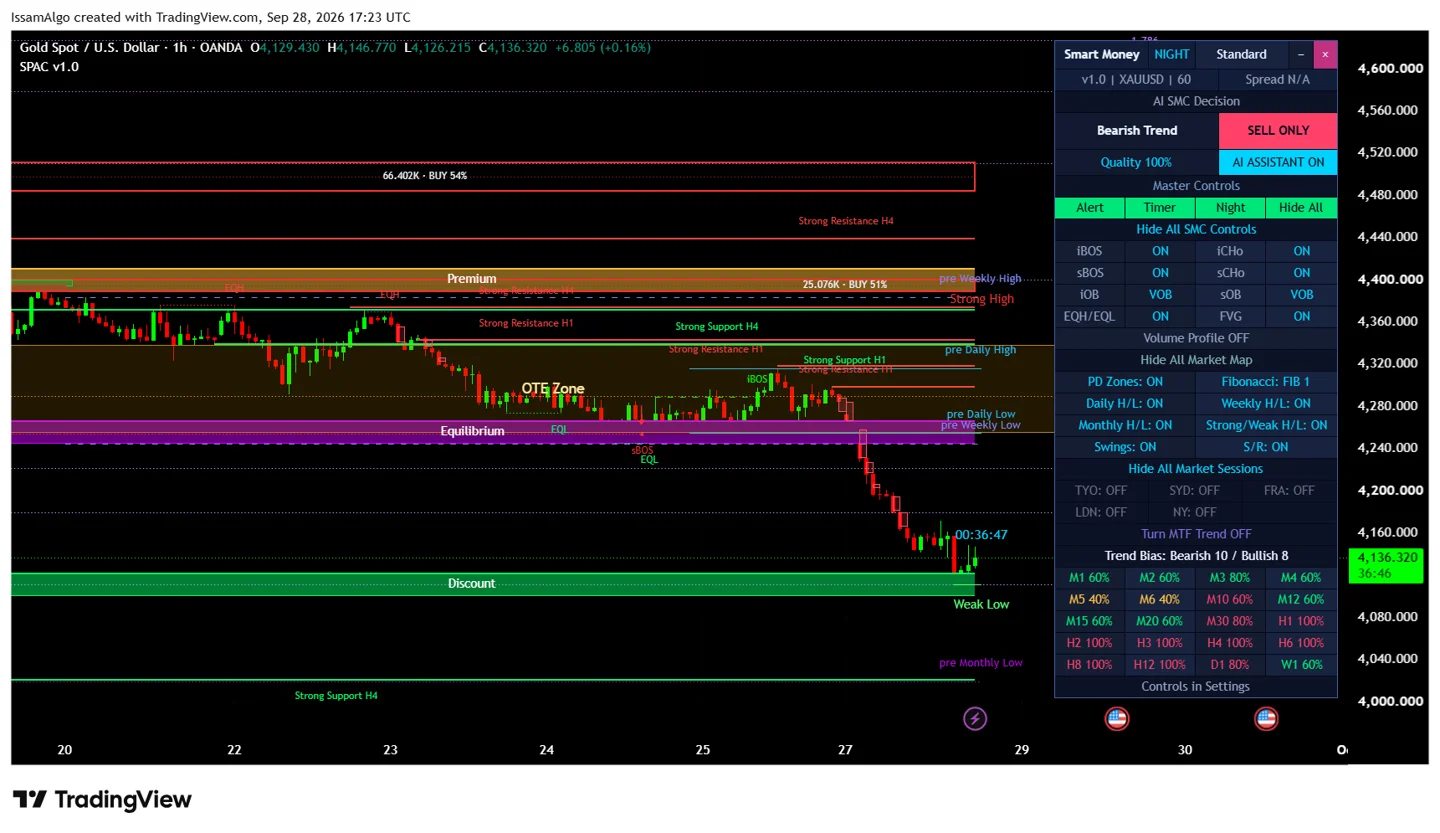
Study market structure and liquidity alongside order blocks, fair value gaps and price-area overlays. Keep the full map or focus on selected chart elements.
Explore details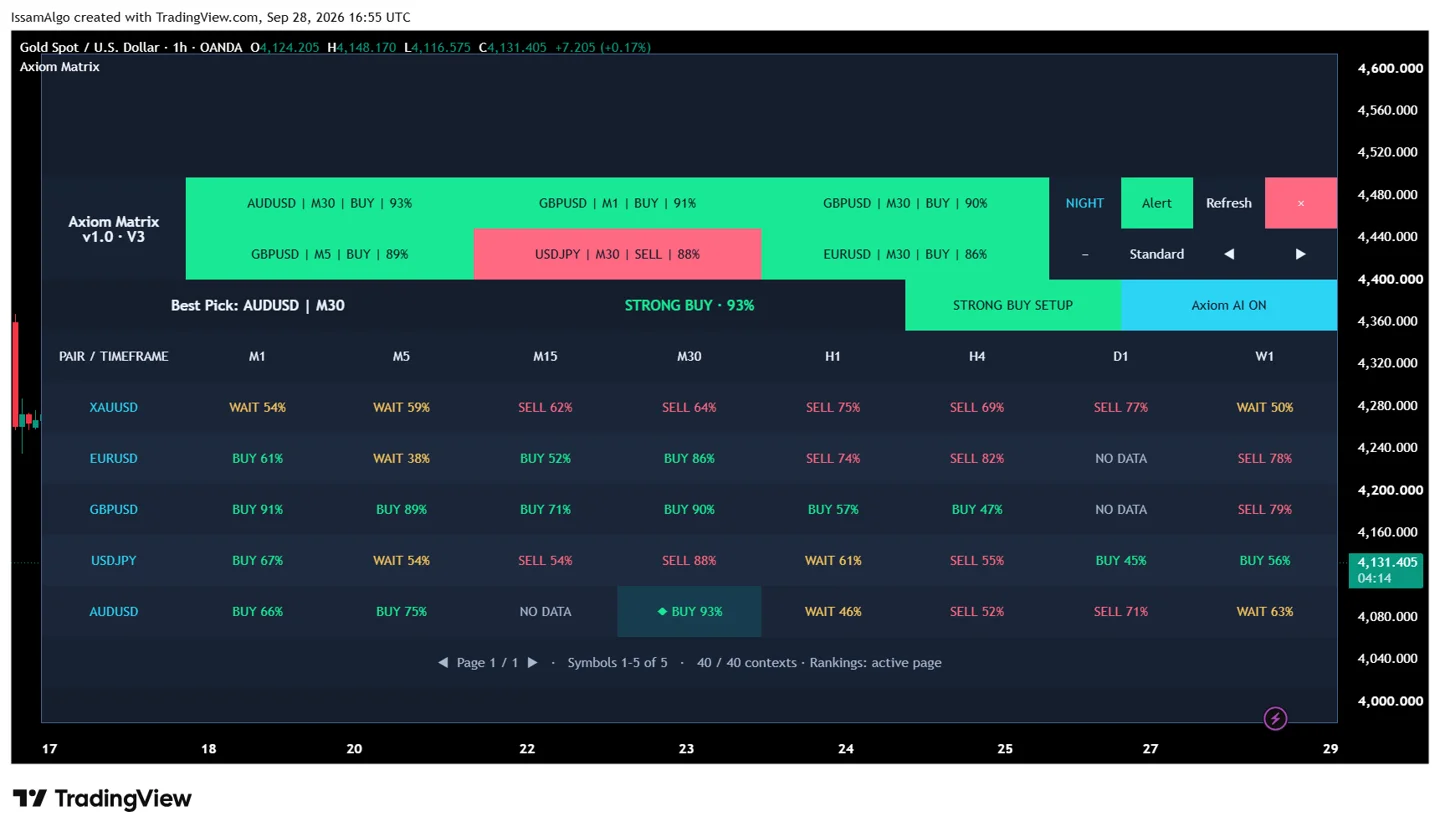
Compare your selected markets and timeframes in one dashboard. Start with the scanner, then open the chart you want to investigate.
Explore details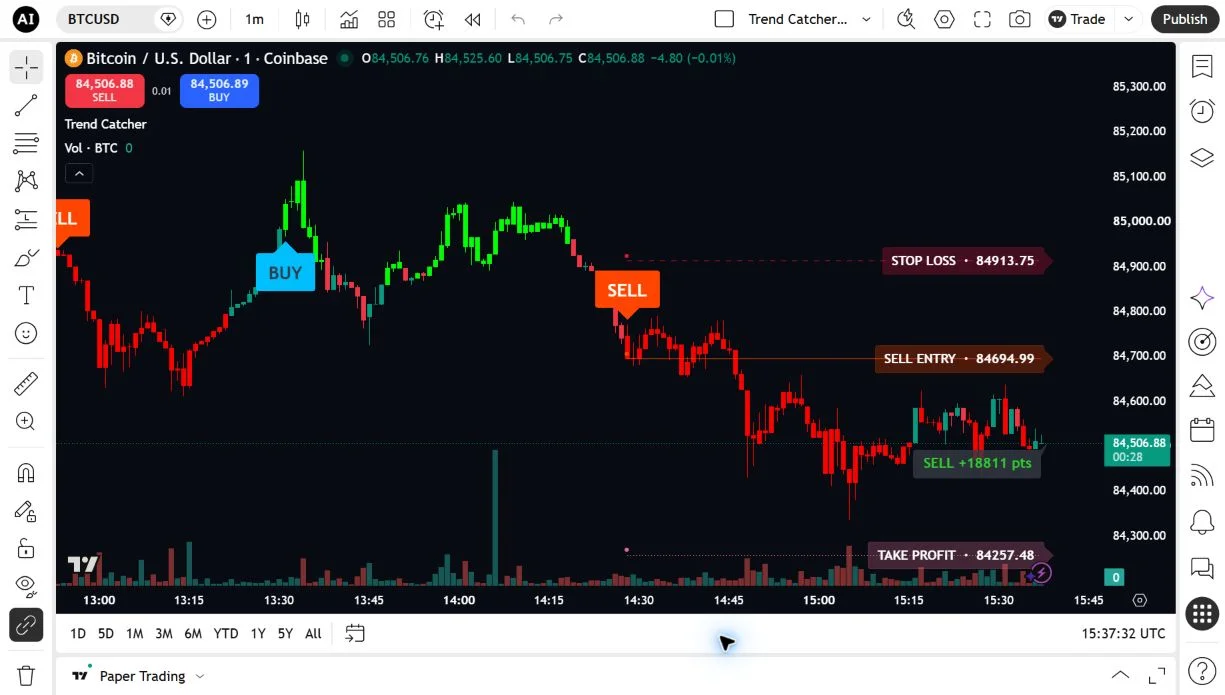
Clear BUY/SELL labels, trend-colored candles and active entry, stop-loss and take-profit references.
Explore details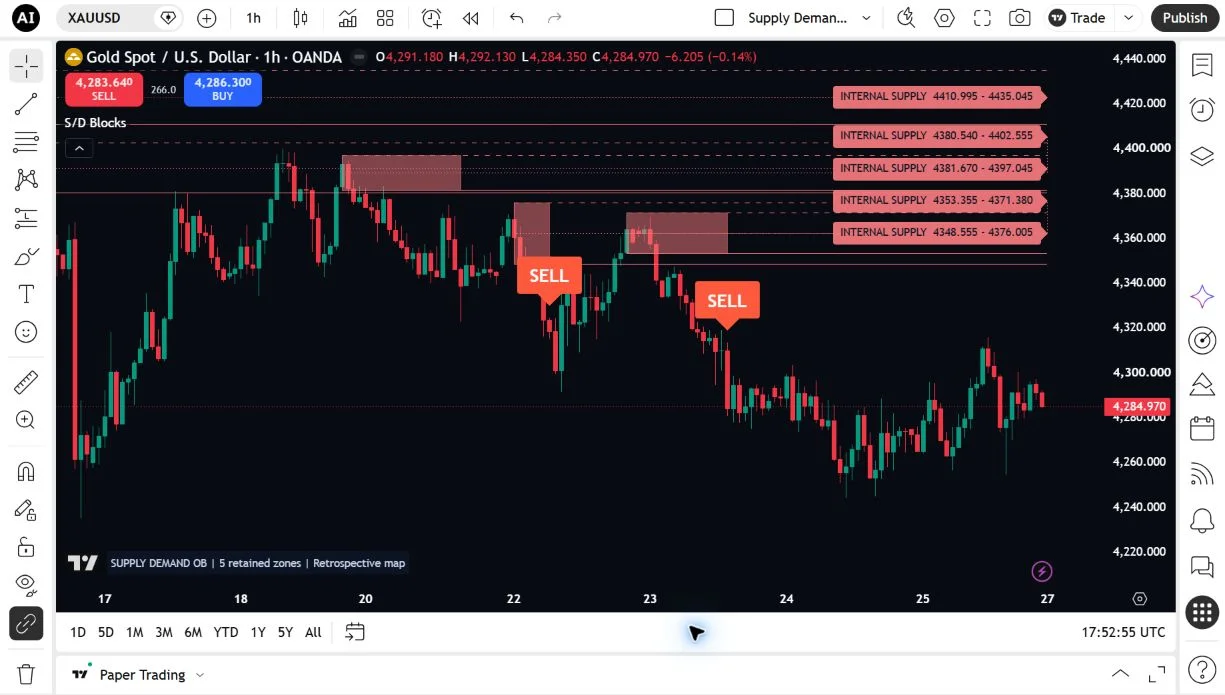
Internal and swing supply/demand zones with compact price captions and clear BUY/SELL structure signals.
Explore details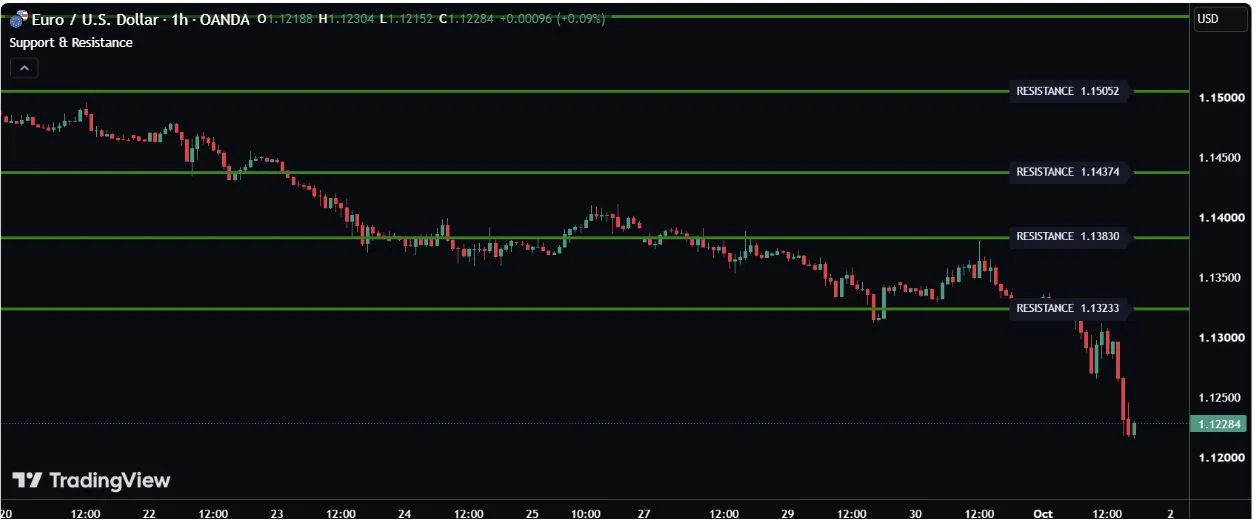
Fractal-based price levels with optional SUPPORT and RESISTANCE captions and selectable analysis timeframes.
Explore details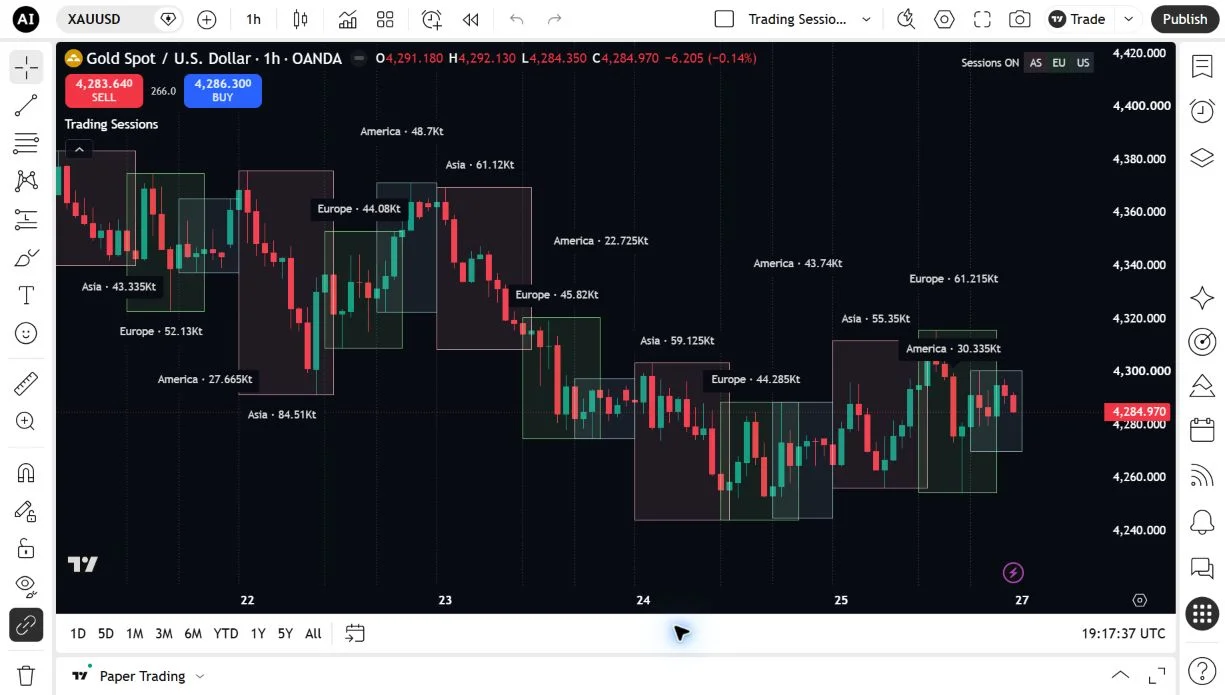
Configurable Asia, Europe and America session ranges, opening markers, time-zone settings and opening-alert conditions.
Explore detailsActual product interfaces · selected examples, not promised trading results.
Scan the market. Read the trend. Map the structure. Plan your next move. 7 complementary indicators, together in one monthly subscription.
7 subscription indicators + 4 independently available free tools.
ALL TRADINGVIEW PRODUCTS
Seven published suite indicators, including Smart Elliott Waves, and four independent free tools.
Included in suiteSmart Trend Trading System↗Included in suiteSmart Elliott Waves↗Included in suiteSmart Harmonic Patterns↗Included in suiteUnix Scalper↗Included in suiteAtomic Analyst↗Included in suiteSmart Price Action Concepts↗Included in suiteAxiom Matrix↗Free toolTrend Catcher↗Free toolSupply Demand Order Blocks↗Free toolSupport and Resistance↗Free toolTrading Session Time With Alert↗Choose the right view for the question in front of you. Every image below shows the actual TradingView indicator. Select an image to inspect it at a larger size.
Explore possible wave structures at three swing scales, with a read-only status panel and optional price references.
Included in the Issam Algo Suite. Access is activated manually after verification. Wave interpretations can change; hypothetical levels are not orders or guaranteed outcomes.
Explore 88 harmonic variants through a family-selection dashboard. Focus on Gartley, Bat and Perfect AB=CD, or choose individual variants.
Included in the Issam Algo Suite. Active swings and projections can change; reference levels are not executed trades. Access is granted manually after payment verification.
Bring trend direction, cloud layers, signals and chart levels into one view. Choose the analysis profile and amount of detail that suit your workflow.
Selected historical examples use expanded display history. The panel shows the latest available readings, not its historical state. Excursion and ledger values are analysis statistics, not realized profit or verified trading performance.
Follow filtered directional signals with compact trade plans and six timeframe cards. Review simulated outcomes in an organized dashboard.
Shown on EURUSD 30-minute standard candles. Selected historical example; point movements and simulated balance exclude trading costs and are not realized profit. Use standard candles; non-standard chart types pause the analysis.
Read price action, momentum and multi-timeframe context alongside visual trade plans. See the relationship between entry, stop, target and break-even levels.
Selected historical examples illustrate the interface, not typical returns or broker fills. Shown on Gold H1. A Gold H4 configuration exceeded TradingView’s memory limit in testing; higher-timeframe compatibility remains under review.
Study market structure and liquidity alongside order blocks, fair value gaps and price-area overlays. Keep the full map or focus on selected chart elements.
Some historical structure marks require later confirmation before appearing at their earlier chart location.
Compare your selected markets and timeframes in one dashboard. Start with the scanner, then open the chart you want to investigate.
Rankings cover the active scanner page. Scores describe rule alignment, not the probability of a profitable trade.
Explore trend signals, supply and demand zones, support and resistance, and trading sessions. These four tools are available directly on TradingView without an Issam Algo subscription. The US$27.99 monthly suite covers the 7 invite-only indicators above.
Clear BUY/SELL labels, trend-colored candles and active entry, stop-loss and take-profit references.
Internal and swing supply/demand zones with compact price captions and clear BUY/SELL structure signals.
Fractal-based price levels with optional SUPPORT and RESISTANCE captions and selectable analysis timeframes.
Configurable Asia, Europe and America session ranges, opening markers, time-zone settings and opening-alert conditions.
Review US$27.99 per month and enter your exact public TradingView username. Your TradingView password is never needed.
Send your username and checkout email to Issam Algo Support. We verify payment and manually grant all 7 indicator permissions.
Once activated, open Indicators → Invite-only scripts on TradingView and add the tools to your chart. Access is maintained while your subscription is active.
Monthly access to all 7 published invite-only indicators: Smart Elliott Waves, Smart Harmonic Patterns, Smart Trend Trading System, Unix Scalper, Atomic Analyst, Smart Price Action Concepts and Axiom Matrix, for one TradingView username. The four companion tools are available separately without a subscription.
Yes. Contact Issam Algo Support with your checkout email to request cancellation before your next renewal. Billing recurs monthly; there is no annual commitment.
Use the indicator’s Settings / Inputs to change its configuration. Many panel cells present information rather than acting as clickable buttons. Customize available colors, layouts and display options in Settings.
No. These tools support chart analysis and manual decision-making. Scores, historical signals, pip counts and plan levels are not guaranteed returns or verified account results. Review each indicator’s published documentation and limitations before use.
Yes. Trend Catcher, Supply Demand Order Blocks, Support and Resistance, and Trading Session Time With Alert are published on TradingView. Open a product link above and select Use on chart. No Issam Algo subscription is required; your TradingView plan determines your chart limits.
Trading involves risk. Examples illustrate product features and are not recommendations or promises of performance. TradingView® and Pine Script® are trademarks of TradingView, Inc. Issam Algo is independent and is not sponsored or endorsed by TradingView.
Educational content access. Trading software, signals, coaching and subscriptions are separate.
Standalone collections total $29.98. The bundle intentionally costs less than courses alone. See exactly what is included and access availability.