
CTRADER / WINDOWS DESKTOP
Smart Price Action Concepts
Map market structure, order blocks, liquidity and fair value gaps with an interactive chart dashboard.
Future product updates included
cTrader edition · v1.1 · licensed to your purchasing cTrader ID.
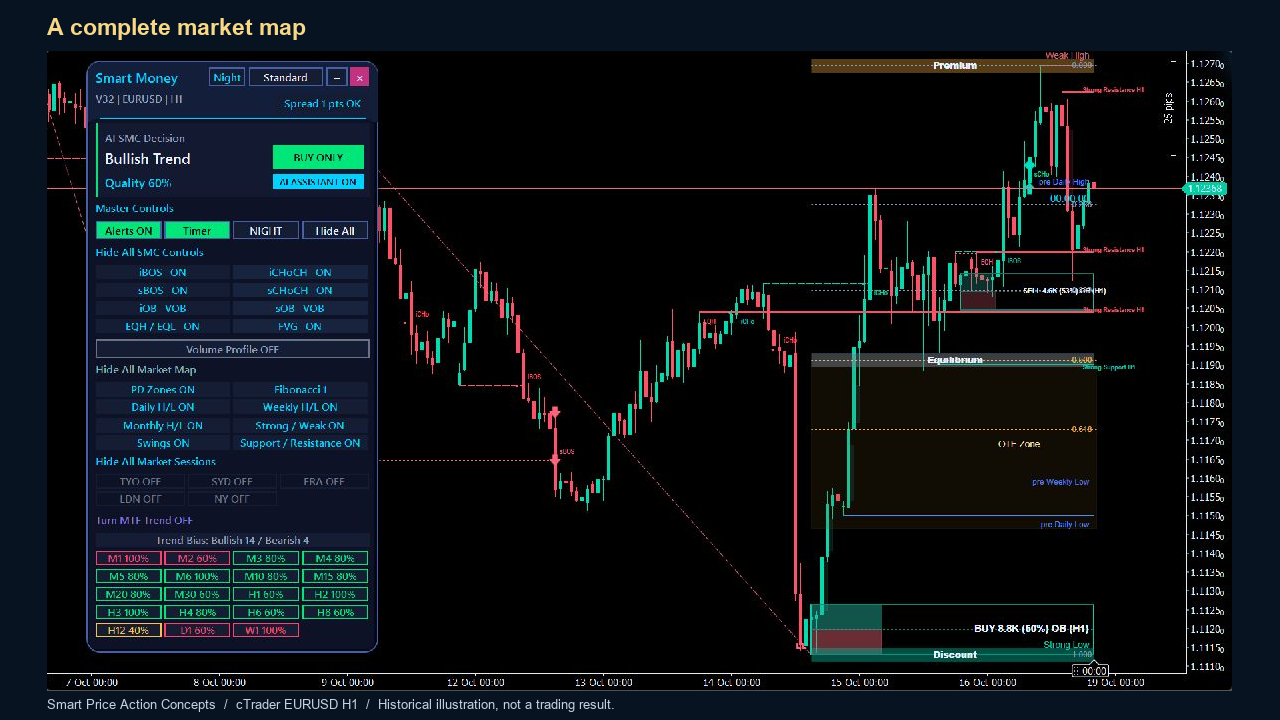
ON YOUR CHART
See the tools in context.
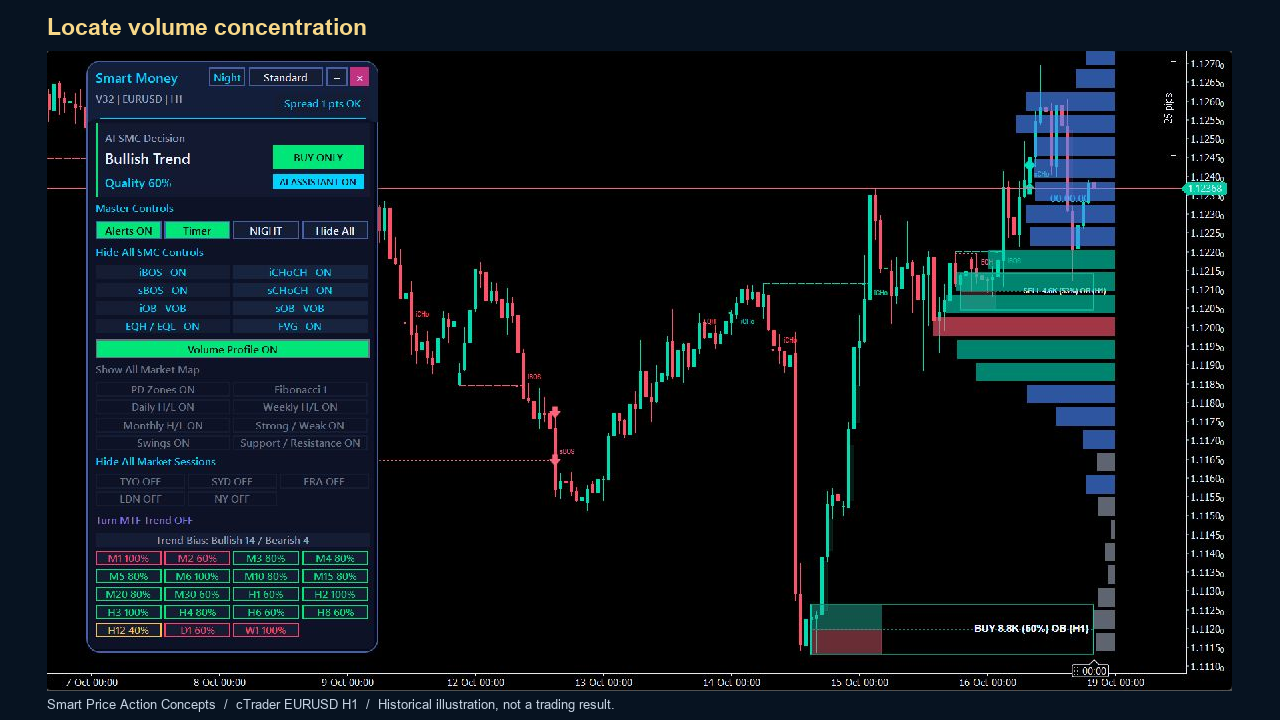
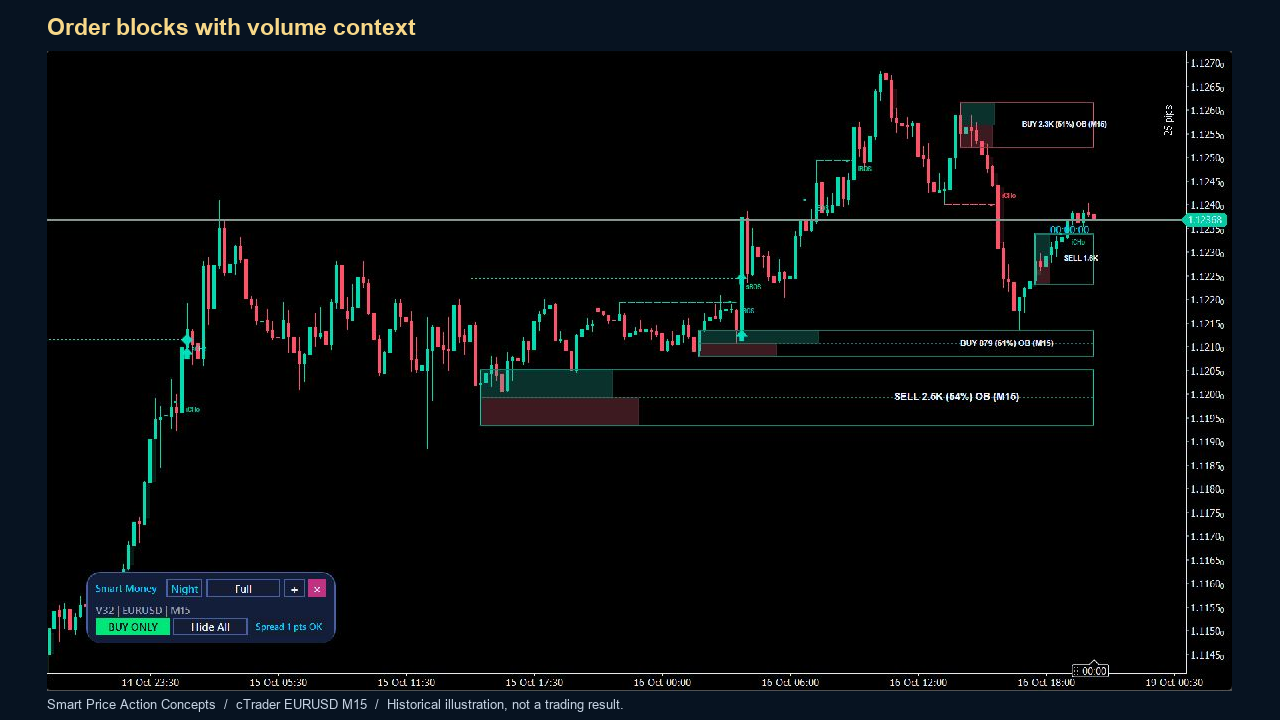
Authentic cTrader screenshots. Some show earlier builds; current controls may differ. Selected historical examples illustrate features, not audited returns or expected performance.
WHAT YOU CAN DO
Build your analysis.
Independent internal and swing structure, BOS, CHoCH, swing labels and equal highs/lows.
Order blocks with presentation/volume modes and fair value gaps.
Premium/equilibrium/discount, Fibonacci/OTE, previous daily/weekly/monthly highs/lows and support/resistance.
Moving-average, MACD, ADX, Ichimoku and SAR votes with multi-timeframe agreement.
Full/Standard/Compact layouts, independent panel/chart themes and feature-group controls.
Optional chart-volume profile with point of control/value area, configured sessions and popup/sound/email alerts.
GET STARTED
From the Store to your chart.
Install your indicator
- Obtain the named indicator from its official cTrader Store product page using your cTrader ID.
- Install/synchronise it in the desktop cTrader app using the Store instructions, then open a demo chart.
- Add the indicator from the chart Indicators menu, review native parameters and allow enough history to load.
Before you start
- cTrader Windows desktop; broker-supported time-based chart with sufficient history.
- Use the cTrader ID that owns the Store purchase.
- Email alerts require working cTrader email settings and valid sender/recipient parameters.
YOUR FIRST SESSION
Learn the workflow.
- 01
Start with a time-based demo EURUSD H1 chart and load history.
- 02
Choose internal/swing structure and the zone groups relevant to your analysis.
- 03
Inspect BOS/CHoCH and surrounding order blocks, liquidity and gaps in price context.
- 04
Compare enabled votes and multi-timeframe agreement; use a supported panel timeframe to change the chart.
- 05
Review the master and individual event-alert switches; configure session hours/offset and optional volume profile deliberately.
Understand the limits.
- No automatic orders or trade management.
- Quality measures agreement among analytical inputs, not winning probability.
- Pivot confirmation can appear on earlier candles; structures/zones develop and invalidated zones may disappear.
- Panel context is current even while viewing old chart history.
- Volume is chart tick volume; sessions follow configured hours and offset.
Analysis indicators do not guarantee results. Trading involves risk; test configurations on a demo account first.
Questions, answered.
Do zones stay fixed forever?
No. Structures develop with new bars; confirmed pivots can be displayed on earlier bars and invalidated zones can be removed.
Is volume exchange-traded volume?
This implementation uses cTrader chart tick volume.
How are session ranges timed?
By the configured session hours and offset; check those settings against your intended session.
Which account receives the licence?
The cTrader ID signed in to cTrader Store when purchasing. Use that same cTID in the desktop app; the purchase cannot be started by a different cTID.
Does this run in cTrader Web or Mobile?
Custom indicators run in desktop cTrader. These product examples and checks are from Windows; independent Mac validation is not available. Web and Mobile support built-in indicators only.
YOUR NEXT STEP
Smart Price Action Concepts
One cTrader indicator. One payment of $29. Future versions included.
Purchase and installation are handled by cTrader Store using your cTrader ID.
Need a hand?
Use the setup steps above and the official cTrader guides, or contact Issam Algo for product help.